Retail shrink statistics: How retailers lose $112 billion annually
Retail shrink costs retailers billions annually. Explore verified data on the scale of the problem and effective reduction strategies.
Written by
Everseen
Read time
10 min
Published on
Sep 22, 2026

Shrinkage has always been a problem in retail. In the past few years, some retailers have reported it trending down while others show it climbing. To fight this erosion of the bottom line, retailers have tried a wide range of strategies, from visual deterrents to dedicated loss-prevention systems, while also streamlining operations with leaner staffing, self-checkout, and automation.
But exactly how much shrinkage is in the industry today? What tends to make it worse/better, and what retailers are doing to address it.
We answer these questions and more using real numbers in this article.
Read more: Guide to Shrink and Loss Prevention for Retailers.
Statistics on overall retail losses due to shrink
Shrinkage is the gap between the inventory a retailer has on hand and what records say it should have. It remains one of the industry’s primary sources of loss and profit drain. Here's what the numbers say about the scale of the problem today.
- The average shrink rate for retailers is between 1.4% and 1.6% [1]. Reports from NRF show that shrink jumped 0.2% between 2021 and 2022 alone [1]. Grocery and general merchandise retailers often operate on net margins between 2 and 4%, so even a single percentage point increase in shrink can cut into a meaningful share of profit.
- At 1.6% of total retail sales, shrink represented $112.1 billion in losses for retailers in 2022, up from $93.9 billion the year before [1].
- For European grocers, ECR Retail Loss estimates shrink rates at around 1.8% of turnover. For the broader FMCG sector, manufacturing included, that figure rises up to 2.31% [2].
- At average margins, shrinkage represents 60% of profit for Eurpoean grocery retailers [2].
Retailers typically factor expected shrink into product pricing. But when it rises beyond that baseline, the difference comes directly out of profit. That increase is often concentrated in specific areas which we'll break down next.
Statistics on retail shrink losses by channel
According to NRF [1], there are four sources of shrink in a retail environment: internal, external, process and errors, and unattributable shrink. Here are figures on their contribution to total shrink.
- Theft (internal and external combined) accounts for 65% of retailers' shrink. External theft alone accounts for an average of 36%, more than a third of all shrinkage, and includes shoplifting and Organised Retail Crime [1].
- Internal (employee) theft accounts for 29% of shrink loss. This includes cash and deposit theft, merchandise theft, sweethearting, and discount/coupon abuse [1].
- Average dollar loss per internal theft investigation is $2,180 [1]. Not all cases of theft are investigated, but for every instance of internal theft audited, retailers discover an average loss of over $2,000.
- Process, control failures and errors account for 27% of retail shrink loss. The figure represents losses from administrative mistakes, vendor fraud, and receiving errors [1].
- Unknown losses account for 6% of total shrink, while other losses are estimated to be 1% [1].
External theft remains the largest source of shrink for retailers, but internal theft and process failures together account for a comparable share. But one channel in particular – self-checkout – has attracted growing attention in recent years as a singular source of great loss for retailers. Figures in the next section quantify the problem.
Statistics on retail shrink losses due to self-checkout
Retailers rolled out self-checkout to increase efficiency, improve the shopping experience, and reduce costs. The trade-off is a new set of loss patterns that didn't exist at staffed checkout lanes, and the data below shows just how much they add up.
- SCO implementation is associated with an average increase of +0.26 percentage points in loss in the first year [3].
- Based on a study of 8 grocery retailers and 1,300 test stores, stores with self-checkout see an average 22% increase in loss after implementation [3].
- For every additional 1% of transactions moving through SCO, loss increases by an additional 0.030% to 0.048% [3].
- Missed scans are the most frequent loss type, and they occur in 1–4.8% of all SCO transactions [3].
- According to 2024 estimates, loss accounts for approximately 0.46% of all self-checkout sales [3].
- For UK retailers, stores with SCO had an average shrink of 1.96%, compared with 1.35% for stores without SCO [3]. This is a 31% difference in loss rates between the two.
- For the average store’s self-checkout counter, every 10,000 additional SCO transactions results in 1,000 additional calls to staff for help, 100 card payment issues, and 90 walkaways. Staff reaction times also slow by an average of 2.27 seconds [3].
These figures show that self-checkout can introduce new sources of loss, along with real friction in day-to-day store operations. But rolling back SCO isn't necessarily the answer. In the next section, we’ll look at data on strategies retailers use to help close the self-checkout loss gap.
Retail shrink reduction statistics
Retailers use a range of strategies to mitigate shrink, though not all are equally well documented. Here's a look at three approaches and their measured impact, along with the broader toolkit retailers continue to rely on.
- Exit gates improve store loss by 30 to 40 basis points over 12 months. Based on ECR Retail Loss's reporting, the same retailers also saw a 30% reduction in cancelled receipts, a 28% reduction in walkaways, and an average inventory adjustment improvement of $4,300 per week [3].
- Offering enhanced training to self-checkout supervisors improves store shrink by 23 basis points, along with a 30% faster response time to alerts, and a 200% increase in attendants scanning large items [3]. This is a testament to the effect of people-based interventions. Other long-standing tools, like RFID tagging, shelf locks and CCTV, remain staples of the retailer toolkit, even without much reported data on their effectiveness.
We also see a positive trend in the wider industry picture. In early 2026, executives at Kroger, Target, Dollar General and TJX told investors that falling shrink was boosting margins and profits. Target and TJX's CFOs also stated that shrink had fallen back to pre-pandemic levels [4].
It’s not clear how much of this decline comes down to specific shrink-reduction tactics and how much is due to broader operational changes. But it is a reminder that it’s possible to reduce shrink, even at scale for multi-store estates.
Statistics on Everseen’s impact on retail loss
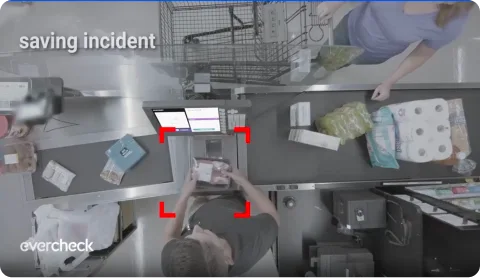
Self-checkout loss prevention is one of the most powerful applications of Vision AI in retail today, and for over a decade, Everseen has helped retailers tackle the problem head-on. It’s Vision AI solution processes over 15 million retail transactions daily across 10,000+ stores worldwide.
Below, we share statistics behind Everseen’s impact on retail shrink and show why 11 of the world's top 20 grocery retailers rely on its platform.
- Everseen’s Evercheck tackles 90% of checkout shrink, detecting over 30 unique loss and error patterns, including non-scan incidents, concealment, and abandoned transactions.
- Stores using Evercheck see a 30% reduction in staff interventions at self-checkout. That frees up team members to focus on higher-value tasks and step in only when their help is genuinely needed.
- Evercheck’s Soft Nudge approach clears over 80% of non-scan events without staff involvement. The Soft Nudge is a screen prompt that lets customers self-correct missed scans.
- In 2025, stores that deployed Evercheck saw a 30% increase in loss recovery.
- On average, Evercheck adds $88,000 to a store's bottom line annually. This figure is weighted toward Everseen's largest grocery deployments and may be higher than what smaller-format stores typically see.
- Independent research from Forrester found that retailers using Everseen's solutions see a 374% ROI over three years.
Taken together, these stats show that shrink and self-checkout loss is manageable without adding to staff burden or disrupting store operations.
Retail’s shrink problem is solvable
Retail shrink isn't going away, and self-checkout has only added new layers to an already complex problem. But the data above shows that retailers have effective data-backed solutions that don’t involve rolling back the convenience self-checkout offers customers.
Everseen has spent over a decade building towards this outcome. If you'd like to see how it works in practice for your store, contact our team.
References
- National Retail Federation & Loss Prevention Research Council, 2023 Retail Security Survey
- ECR Retail Loss, Measuring Retail Shrink: KPIs, Methods and Benchmarks
- ECR Retail Loss, Self-Checkout Loss Report 2026
- Retail Dive, "Retailers report shrink levels down from pandemic highs" (Daphne Howland, March 2026)
Subscribe to the blog
Subscribe to Everseen's blog to receive emails about new posts and resources.



.jpg)